Not Our Demo Store: What Product Descriptions Look Like on 225 Real Shopify Storefronts

We read 8,019 products from 225 live Shopify storefronts that have nothing to do with us. The median product description is 701 characters of plain text.
Thin descriptions are real, but they are not everywhere. They pile up: of the 205 stores with enough products to measure, 102 had no thin descriptions at all, while 10 had almost nothing else.
Everything below is one measurement, on one day, of one thing — how long the text is. That is narrow.
The numbers
| What we measured | Value |
|---|---|
| Storefront addresses we started from | 230 |
| Storefronts that answered | 225 |
| Products read | 8,019 |
| Products with an empty description | 389 (4.9%) |
| Products with a description under 200 characters | 1,265 (15.8%) |
| Median description length | 701 characters |
| Stores with at least 5 products | 205 |
| Median per-store share of thin descriptions | 2.0% |
| Quartiles of that per-store share | 0.0% and 18.1% |
| Stores with zero thin descriptions | 102 |
| Stores where nearly every description is thin | 10 |
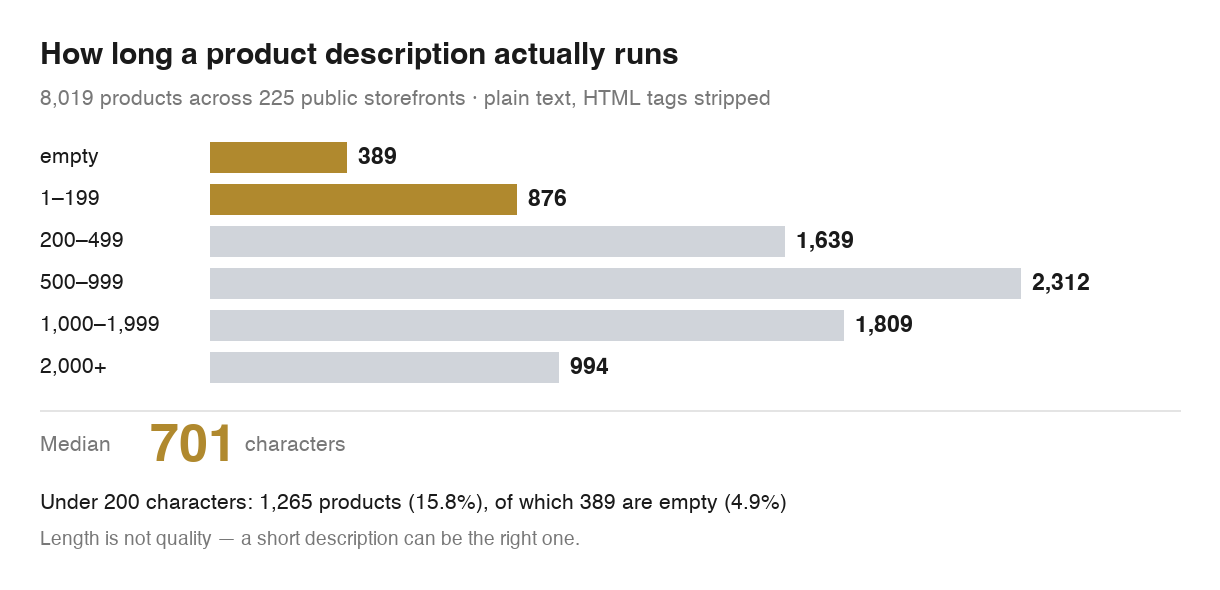
Lengths are measured as plain text — HTML tags are stripped before counting, so this is the number of characters a shopper actually reads.
One caveat belongs right here rather than at the bottom: "under 200 characters" means short, not bad. Some of those 1,265 are exactly the right length for what they are selling. Which ones is a judgment we did not make, and a character count cannot.
Where the list came from
The addresses come from the Store Feedback board on the Shopify Community forum, where merchants post their own storefront URL and ask other merchants to look at it.
That gives the list four properties worth naming:
- Public. The URLs were posted by the store owners, in the open, on a forum anyone can read.
- Reproducible. The board is still there; anyone can pull the same kind of list and run the same check.
- Self-selected. Every store is on the list because its owner chose to put it there.
- Unrelated to us. None of this comes from our customer list. We did not look at who uses our product, and could not have told you either way while collecting it.
The method was a single anonymous request per store: GET /products.json?limit=50, the same public catalogue endpoint any Shopify storefront serves unless it has been locked down. Collection date: 2026-09-05. Of the 230 addresses, 225 answered; we left the rest out rather than guessing.
Those 230 are what survived a larger list. The board yielded 474 candidate domains over nineteen months, and 244 of them did not answer with a readable catalogue. The largest groups: 118 no longer resolve, 56 return 404, 31 come back with the HTTP status Shopify serves for a frozen unpaid store, and 18 are password-protected or no longer Shopify. Those four account for 223; the remaining 21 are smaller buckets and a handful our records do not classify. Not answering is not proof a store is gone — a locked-down storefront reads the same way from outside as a dead one. Every store below is one that did answer on the day we looked. Stores that failed hardest are the ones most likely to be missing from it.
This is a convenience sample, not a random one. A merchant who asks strangers on a forum for feedback skews newer, smaller and more likely to be struggling than one who does not. Every number here should be read as "among stores of that kind," not "among Shopify stores." If you want to know what a mature catalogue looks like, this is the wrong instrument.
We are also not naming any store, domain, or recognisable product. The point was the shape of the distribution, and the shape does not need anyone's name attached to it.
The distribution, store by store
Read only the catalogue-wide figure — 15.8% of products under 200 characters — and you would conclude that most stores have a scattering of thin ones. That reading is wrong.
Take the 205 stores with at least 5 products, so a per-store percentage means something. The median store's share of thin descriptions is 2.0%. The quartiles are 0.0% and 18.1%. And 102 of those 205 stores — about half — have no thin descriptions at all.

The per-store shares do not cluster around the catalogue-wide 15.8%. They pile up at zero, with a long tail stretching to the stores where nearly every description is thin.
At the other end, 10 stores have almost nothing but thin descriptions. Between them they account for 323 thin products — a quarter of the 1,265 we found across all 225 stores, concentrated in ten of them — a small number of stores carrying a disproportionate share of the total.
So the summary is concentration, not prevalence. This is not "merchants write bad descriptions." It is closer to: most of these storefronts have normal-length descriptions on nearly everything, and a small group has a catalogue that was filled in mechanically — imported, bulk-created, or never revisited — and left that way.
That distinction matters. A problem spread thinly across every store is a habit problem, fixed by changing how you write. A problem concentrated in a few catalogues is usually an event problem — an import, a migration, a supplier feed — fixed by going back and filling in what the event skipped.
The empty descriptions are the unambiguous end of this: 389 products, 4.9% of what we read, have no description text at all.
The 50-product ceiling
One request per store, limit=50, means we saw at most 50 products per storefront. 126 of the 225 stores hit that ceiling: their real catalogues are larger than what we read, and we do not know by how much.
The obvious worry is that this bends the result. So we split the sample and checked.
- The 99 stores that did not hit the ceiling gave us 1,719 products, of which 13.8% had descriptions under 200 characters.
- The 126 stores that did hit the ceiling came in at 16.3%.
Same direction, close enough in size that truncation is not manufacturing the pattern. Had the truncated stores been dramatically cleaner or dramatically worse than the ones we read in full, the two figures would have pulled apart.
What this does not show is that larger stores are worse. Hitting the ceiling only tells you a catalogue has more than 50 products — not how many more — and the 16.3% figure is computed on the first 50 products of each of those stores, not on their full catalogues. The only claim here is narrow: cutting each store off at 50 did not send the result somewhere it would not otherwise have gone.
What this data cannot answer
We measured one thing: characters of plain text in a product description. That is a crude instrument, and it is worth being precise about the edges.
Length is not quality. A long description can be padded, repetitive or wrong. A short one can be exactly right — a single well-chosen sentence about a simple product, for a shopper who already knows what they are buying, is not a defect. When we say 1,265 products are under 200 characters, we are saying they are short. Not that they are bad, and not that they were "filled in but useless." Deciding which short descriptions are fine and which are a gap needs a human who knows the product, and we did not do that here.
We can show you what "under 200 characters" looks like, though not from this sample — the measurement recorded lengths, not text, and the stores are anonymous. Here is one from our own demo store, a round acacia tray, 62 characters:
Solid acacia, finished by hand. Hand wash and dry immediately.
Nothing about that is wrong. It is accurate, it is readable, and for a shopper who already knows what a serving tray is, it may be all they need. It also says nothing about size, what it is for, or why two of them will not match — which is the judgment call the character count cannot make for you.
Other things people reasonably ask, which this data genuinely cannot tell you:
- Alt text. We read descriptions, not images. Nothing here supports any claim about how many images have alt text.
- Inventory. We did not look at stock levels, so nothing here says whether these products are in stock.
- Draft products. The public endpoint serves published products. Drafts are invisible to this method, so a store could have a pile of unfinished products we never saw.
- Duplicate descriptions. We are not reporting duplicates here, so we quote no duplicate figure at all — not a count, not a percentage.
- Same name, same product. Matching titles are not necessarily duplicates; variants, bundles and seasonal re-listings all look like that from the outside.
What this means for your store
The useful move is not to compare yourself to 15.8% — that figure describes a population you are not a member of. Look at the per-store distribution instead: stores tend to land near one of two places, nearly all descriptions of a normal length, or nearly all of them thin.
So the first question is which shape your own catalogue has. That is answerable in an afternoon: sort your products by description length and look at the bottom of the list. If there are a handful of short ones and you can name why each is short, you are in the 102. If the bottom keeps going, something happened to your catalogue once and nobody went back.
The second question is the one length cannot answer: of the short descriptions you have, which are missing something a shopper needs? That means opening products and reading them. For a starting point, we collected examples of product descriptions that do the job from real storefronts.
Arvio is an AI Store Operator: it works inside your store, looks at what is there, drafts the change, then stops and shows you the draft before anything is written. For a catalogue with a long tail of short descriptions, the expensive part is not deciding what to say about a wooden tray — it is doing that several hundred times. The part worth keeping slow is approval: every change is shown for review before it lands, which is the whole design of how Arvio writes a fix.

One product, before and after a drafted rewrite. The decision to accept it stays with the merchant.
The 10 stores in the tail of this sample do not have a writing problem. They have a backlog. Those are different problems, and the second is more tractable than it looks.
Arvio: AI Store Operator — install it on the Shopify App Store.
Questions people asked about this data
How did you pick these stores?
We did not pick them; their owners posted them on the Store Feedback board of the Shopify Community forum. That makes the list public and reproducible — anyone can rebuild it from the same board.
Does the 701-character median include HTML tags?
No. We strip the markup out and count the plain text that remains, so the number reflects what a shopper reads.
Is a description under 200 characters a problem?
Sometimes, and this data cannot tell you which times. A short description on a simple, familiar product can be the right call; one on a product with materials, sizing and care instructions to communicate probably is not. The 1,265 figure is a list of candidates to look at, not a list of defects.
Why only 50 products per store?
We asked each storefront for 50 products and no more — limit=50 was our choice, not a cap Shopify imposed. 126 stores hit that ceiling, so their real catalogues are bigger than what we read. We checked whether that bent the result: the 99 untruncated stores came in at 13.8% thin, the truncated 126 at 16.3% — same direction, so the ceiling is not creating the pattern. It still means we have not seen those catalogues in full.
Can I run this on my own store?
Yes, and on anyone else's, because the endpoint is public on any storefront that has not restricted it. The harder part is not fetching — it is deciding what counts as thin for your products, a judgement about your catalogue rather than a threshold you can copy from us.
Why other people's stores rather than your own demo store?
Because our demo store is one catalogue we built, and it tells you nothing about how catalogues look in the wild. The trade is a sample that skews newer and smaller.